3.3.2 Environment Protection
Environmental Policy
OAOOpen Joint-Stock Company IDGCInterregional Distribution Grid Company of Urals, being one of the largest distribution grid companies of Russia, is interested in environment safety and compliance of its operations with environmental regulations. Company’s facilities (power lines, substations, production sites) have minor impacts on the environment. The Company’s operations include such environmental impacts, as waste generation, physical effect, air contamination (minimal emissions); the Company has no wastewater discharges to surface water bodies.
OAOOpen Joint-Stock Company IDGCInterregional Distribution Grid Company of Urals acceded to the Environmental Policy of the Energy Sector and took obligations to follow its statements in its operations. The focus of the Environmental Policy is to preserve a benevolent environment for current and future generations. Key directions of the Environmental Policy are:
- Compliance with domestic and international environmental legislation;
- Priority of prevention of adverse environmental impact over liquidation of adverse environmental consequences;
- Energy-saving and energy efficiency activities;
- Application of best-in-class affordable technologies and innovations, ensuring compliance with environmental requirements and minimization of adverse environmental impact;
- Preservation of biodiversity and rehabilitation of disturbed soils;
- Stage-by-stage decommissioning of PCBpolychlorinated biphenyl-bearing and oil-filled equipment and its replacement with environmentally-friendly one;
- Development and improvement of the Company’s Environment Management System;
- Improvement of production environmental control system;
- Upgrading of environmental skills for maintenance and repairs teams.
OAOOpen Joint-Stock Company IDGCInterregional Distribution Grid Company of Urals has 191 facilities with an adverse impact on the environment, incl. 116 III category facilities and 75 IV category facilities. OAOOpen Joint-Stock Company IDGCInterregional Distribution Grid Company of Urals has a license for collection, transportation, processing, utilization, deactivation, dumping of hazard Class I-IV waste (in terms of transportation of hazard Class I-IV waste)[33]. The Company has all permission documentation. In 2021, we prepared drafts of the sanitary protection zones for 20 production sites, obtained sanitary and epidemiological inspection reports on the compliance with sanitary rules and norms. Boundaries of sanitary protection zones are set on the boundaries of the sites.
OAOOpen Joint-Stock Company IDGCInterregional Distribution Grid Company of Urals extracts groundwater at 10 wells under the extraction licenses for in-process and service water supply, incl. firefighting, of production and maintenance depots.
In compliance with the 2018-2024 schedule on decommissioning and disposal of PCBpolychlorinated biphenyl-bearing equipment, we passed no PCBpolychlorinated biphenyl-bearing equipment for disposal during 2021. We have only 2,426 elements of static capacitors left on the “Mikhailovskaya” substation (out of 8,666 static capacitors) after passing 6,240 static capacitors for disposal in 2015-2019. Replacement of 2,426 elements of static capacitors is covered by the investment program, passing for disposal is scheduled in 2023. In 2021, the Company conducted activities to preserve biodiversity and land. 2,660 bird-protection devices were mounted on 6-10 kVkilovolt power lines in the Perm, Sverdlovsk and Chelyabinsk regions. The bird-protection devices were mounted on power lines located near water reservoirs, bird migration routes and nature reserves. In 2021, we mounted such devices in the monument of nature (Kashtak pine wood) in the Chelyabinsk region.
In 2021, the Company arranged a set of trainings for the employees: 49 directors and specialists underwent training on environment protection and ecological security, 138 employees were trained to process hazard Class I-IV waste.
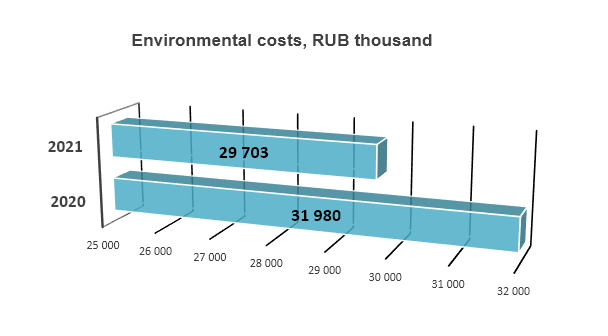
Environmental Costs
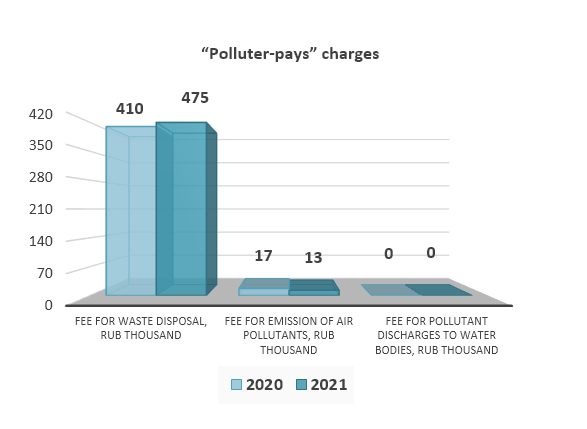
Decrease of the 2021 environmental costs, in comparison to 2020, was due to planned reduction of drafts of the sanitary protection zones, acquisition of waste containers. A 4.3% increase of “polluter-pays” charges in 2021 is due to recalculation of target and actual “polluter-pays” charges.
‘
Air protection activities
The primary air contamination sources are motor vehicles (motor vehicle storage shed, open air or indoor car parks), machine tool use area, welding stations and workshops. All contamination sources have a minor negative impact on the environment. Under the environment control programs the Company conducts laboratory and instrumental surveys of stationary waste resources, controls the quality of air on the boundary of sanitary protection zones, and prepares survey protocols every year. In 2021, the Company conducted laboratory survey of air, soil at waste disposal sites, impact of physical factors on 108 sites. Survey protocols were received. Survey showed that emissions are within the limits. Our production sites do not produce over-the-limits noise, therefore, no noise barriers are required. The Company does not use purification equipment. The volume of air pollutant emissions in 2021 remained within the same limits, as in 2020.
Protection and sustainable use of water resources
For sustainable use of water resources and water use metering we mounted water meters that undergo regular calibration tests. The Company concludes contracts on water supply and disposal on time, conducts administrative procedures, improves performance discipline in terms of energy saving, conducts laboratory surveys of quality of ground water, oversees compliance with license agreements. All requirements of license agreements are complied with on time and in full. We conducted laboratory surveys of ground water quality. A 14% YoYyear on year increase of water consumption and wastewater disposal was influenced by return of employees back to offices due to termination of remote working as the epidemiological situation improved.
Conservation of land
Pursuant to the Regulations[34], in compliance with the approved annual schedule, the Company conducts production environmental control. In 2021, all scheduled inspections were conducted, 199 sites in branches and production departments were inspected. Inspection were partially remote due to sanitary epidemiological situation.
Wastes from the Company’s operations are stored at specially equipped waste accumulation locations (containers, reservoirs, sites located on impervious surface), easily accessible for lifting devices and motor vehicles. Waste accumulation sites are marked and located in line with approved schemes. Memos on waste accumulation sites are placed on stands. Wastes are timely handled for utilization, decontamination, allocation under relevant contracts to reduce adverse impact on the environment from accumulated waste. Soil near waste accumulation locations undergoes laboratory inspections, excessive concentration of harmful substances was not registered.
For conservation of land and reduction of adverse impact, during 2021 the Company has arranged 11 sites for containers for solid municipal waste, oil waste, old tires, oil-filled equipment, arranged waste paper accumulation sites, acquired containers for oily rags, solid municipal waste, polyethylene, factory waster, oil waste, 77 street bins, 30 demercurization sets, 27 spill pans for oil waste, 15 canvas covers to protect wastes from precipitation, 592 liters of Trans-neft decontaminant, 4,231 kg of absorbent to liquidate possible oil product splashes.
A 22.5% YoYyear on year decrease of waste handed over for recycling was due to reduction of accumulators, ferrous and non-ferrous scrap due to reconstruction and dismantling of substations and power lines.
The Company also arranged sanitation and beautification of territories near its buildings (branches, PDZpower distribution zone), substations, power masts and other constructions. As a part of landscaping, the Company planted blue spruces and birch-trees on PDproduction department ’s production sites.


| MU | 2019 | 2020 | 2021 | 2021/2020, % | |
| Emissions of air pollutants | tons | 48.6982 | 43.6373 | 43.02 | -1.4% |
| Waste handed over for recycling | tons | 1,256.054 | 1,494.023 | 1,157.45 | - 22.5% |
| “Polluter-pays” charges | RUBruble thous. | 383.682 | 426.611 | 487.68 | + 4.3% |
| Bird-protection devices | pcs | 2,471 | 3,672 | 2,660 | - 27.6% |
Energy consumption and energy-saving
The Company has the Energy-saving and Enhanced Energy Efficiency Program till 2025, approved by the Board of Directors[35]. The Program stipulates the list of target indicators based on the Federal Law[36] and decrees of regional tariff regulators.
| Target indicator | MU | 2021 target value | 2021 actual value |
| Electricity losses | Million kWhkilowatt-hour | 4,088.6 | 4,212.7 |
| In-house load of substations | Million kWhkilowatt-hour | 67.8 | 77.9 |
| Electricity consumption for economic needs | Million kWhkilowatt-hour | 68.7 | 74.9 |
| Thermal power consumption for economic needs | GCal | 43,646.4 | 49,020.5 |
| Natural gas consumption for economics needs | Thousand m3 | 512.0 | 579.7 |
| Hot water consumption for economic needs | Thousand m3 | 4.1 | 3.6 |
| Cold water consumption for economic needs | Thousand m3 | 103.3 | 107.1 |
| Gasoline consumption by vehicles and machinery | Thousand liters | 5,877.0 | 5,693.9 |
| Diesel consumption by vehicles and machinery | Thousand liters | 6,020.1 | 6,148.3 |
| Equipment with LEDlight emitting diode energy-saving lighting facilities | % | 82.6 | 91.0 |
The growth of electricity losses is within permitted value and is mainly due to increased electricity supply and placement of new grid facilities on the books. A considerable rise of in-house load of substations was impacted by more severe conditions in winter of 2021: average temperature in 1Q 2021 was -8.7°С below average temperature in 1Q 2020. Low temperatures and, therefore, more days with temperature below -25°С have a direct influence on running hours of the heating system for drives, tanks and poles of switching units, RPArelay protection automation cabinets, transformer OLTC. The growth of consumption of resources for economic needs, besides the temperature factor, was due to termination of remote working and return of employees to offices and production sites. This factor shall continue to influence final values of target indicators depending on remote working periods in 2022. Lease of new facilities became an additional factor for the growth.
The YoYyear on year growth of consumption of natural resources was impacted not only by ‘change-of-working-mode factor but also by increased scope of repair works and incidents in utility systems. Redistribution of consumption of gasoline and diesel is due to changes in the list of works, increased connection-related work scope, delivery of materials to remote parts of the country, increased M&Rmaintenance and repair work scope on leased networks, increased running hours of EPS units.
A target indicator “Equipment with LEDlight emitting diode energy-saving lighting facilities” was included into Energy-saving program in 2017. In 2020 it totaled 82%, the target value was outperformed. Nevertheless, we continued our efforts, with the target totaling 91% in 2021. The majority of target-oriented and side activities of the Energy-saving Program was completed. We also performed unscheduled activities focusing on reduction of electricity losses and consumption of resources for economic needs.
| Activities | MU | Actual effect in 2021 | ||
| In MU | tfoe | RUBruble million | ||
| Reduction of electricity losses | Million kWhkilowatt-hour | 48.8 | 5,852.2 | 166.5 |
| Reduction of in-house load of substations | Million kWhkilowatt-hour | 1.1 | 136.7 | 3.3 |
| Reduction of consumption for economic needs | Million kWhkilowatt-hour | 2.3 | 276.6 | 7.6 |
| Thousand GCal | 1.2 | 165.0 | 1.6 | |
| Thousand m3 (gas) | - | - | - | |
| Thousand m3 (water) | 0.3 | 0.1 | ||
| Reduction of fuel consumption | Thousand liters (gasoline) | 162.8 | 184.3 | 5.9 |
| Thousand liters (diesel) | 185.6 | 228.7 | 7.7 | |
| Total effect on target-oriented activities | Million kWhkilowatt-hour | 52.2 | 6,265.5 | 177.5 |
| Thousand GCal | 1.2 | 165.0 | 1.6 | |
| Thousand m3 (gas) | - | - | - | |
| Thousand m3 (water) | 0.3 | 0.1 | ||
| Thousand liters | 348.3 | 413.0 | 13.6 | |
| Total | 6,843.5 | 192.7 | ||
| Total effect on the Program (incl. side activities) | Million kWhkilowatt-hour | 252.8 | 30,341.9 | 824.6 |
| Thousand GCal | 2.6 | 376.9 | 3.9 | |
| Thousand m3 (gas) | 4.2 | 4.9 | 0.0 | |
| Thousand m3 (water) | 0.8 | 0.1 | ||
| Thousand liters | 376.3 | 446.4 | 14.7 | |
| Total | 31,170.0 | 843.2 | ||
Total effect from target-oriented activities under the Energy-saving Program for 2021 totaled 52.2 million kWhkilowatt-hour, 1,154.6 GCal, 0.3 thousand m3 of water and 348.3 thousand liters of gasoline and diesel or RUBruble 192.7 million in money terms. Total effect from target-oriented activities of the Energy-saving Program, Reduction of Losses Program and other side activities in 2021 reached 31,170 tfoe or RUBruble 843.2 million in money terms.
| MU | 2019 | 2020 | 2021 | 2021/2020, % | |
| Consumption of fuel and energy resources for economic needs (office and production buildings) | Thousand tfoe | 16.6 | 15.6 | 16.7 | 7.0 |
| RUBruble million | 309.3 | 345.8 | 380.6 | 10.0 |
Consumption of energy resources in 2021:
| Resources | MU | 2021 target value | 2021 actual value | Variance, % |
| Nuclear energy | N.A | |||
| Thermal power | GCal | 43 646,4 | 49 020,5 | 12,3 |
| RUBruble million | 74,3 | 71,8 | -3,3 | |
| Electricity | Million kWhkilowatt-hour | 4 157,3 | 4 287,5 | 3,1 |
| RUBruble million | 12 019,1 | 12 140,3 | 1,0 | |
| Electromagnetic energy | N.A. | |||
| Oil | N.A. | |||
| gasoline | Thousand liters | 5 877,0 | 5 693,9 | -3,1 |
| RUBruble million | 229,0 | 209,4 | -8,6 | |
| diesel | Thousand liters | 6 020,1 | 6 148,3 | 2,1 |
| RUBruble million | 250,4 | 257,0 | 2,6 | |
| Mazut | N.A. | |||
| Natural gas | Thousand m3 | 512,0 | 579,7 | 13,2 |
| RUBruble million | 3,0 | 2,9 | -3,1 | |
| Coal | N.A. | |||
| Oil shales | N.A. | |||
| Peat | N.A. | |||
| Others | N.A. | |||