3.1.1 Macroeconomic and Industry Review, Market share
Macroeconomic and Industry Review
In 2021, the global economy was in an active recovery, outperforming expectations of the majority of experts. The global growth was supported by incentive measures of budgetary policies in the largest developed countries. Strong global growth was accompanied by accelerated inflation both in developed and emerging markets. Amid recovery of demand, acceleration of inflation in most of the countries was driven by external factors – grown commodity prices, rise in prices for international logistics, bottlenecks of global supply chains.
According to the Federal State Statistics Service[1], Russia’s FY2021financial year 2021 GDPgross domestic product totaled RUBruble 130,795.3 billion. The GDPgross domestic product quantum index, as compared to 2020, totaled 104.7%. IPI and CPI totaled 105.3% and 106.7%, respectively[2]. According to the Russian Ministry of Economic Development[3], consumer demand contributed the most to the recovery of economic activity. Production of key non-resource-based industries (manufacturing industry, agriculture, construction) exceeded pre-pandemic levels. At that, extraction of minerals lost 2%+, if compared to pre-pandemic levels, under OPEC+ agreement.
During 2021, the Bank of Russia changed its key rate 7 times due to several factors. Thus, at the beginning of 2021 the key rate was 4.25%, growing to 8.5% by the year-end.
Mid-term forecasts on macroeconomic fundamentals of the Russian economy were revised downwards. Updated forecast of the Bank of Russia on macroeconomic fundamentals for 2022-2024 (market consensus based on the March 2022 polling of market insiders)[4]:


| 2020 (actual) | 2021 (actual) | 2022F | 2023F | 2024F | |
| CPI (%, YoYyear on year) | 4.9 | 8.4 | 20.0 | 8.0 | 4.8 |
| Key rate (% p.a., year average) | 5.1 | 5.8 | 18.9 | 14.1 | 7.8 |
| GDPgross domestic product (%, YoYyear on year) | -2.7 | 4.7 | -8.0 | 1.0 | 1.5 |
Electricity consumption in 2021 and demand outlook for 2022-2024
According to the UESUnited Energy System of Russia’s functioning report, 2021 electricity consumption by the UESUnited Energy System of Russia totaled 1,090,437.0 mln kWhkilowatt-hour (+56,717.0 mln kW or +5,5%). In 1Q 2021, in comparable temperature environment (net of leap year 2020) consumption grew 1.8% YoYyear on year. Energy consumption was impacted by partial continuation of oil-related restrictions as a result of the OPEC+ agreement. Absence of considerable influence of lockdown measures in 2021, in contrast to their large-scale deployment in 2020, became the driver of electricity consumption growth, starting from 2Q 2021. In 2Q 2021 partial lifting of oil-related restrictions also resulted in the growth of electricity consumption by oil-extracting and oil-transporting companies. Besides, in 2021 metallurgic, machine-building, chemical and lumber enterprises and electrified railroad transportation also increased their electricity consumption.
Electricity consumption in the Company’s areas of service in 2021 totaled 103,104.6 million kWhkilowatt-hour (+3,849.2 million kWhkilowatt-hour or +3.88%)
Electricity consumption in the Company’s areas of service in 2020-2021 (million kWhkilowatt-hour):
| Energy system | 2020 | 2021 | YoYyear on year (+/-) |
| Perm region | 22,397.3 | 23,287.3 | + 890 |
| Sverdlovsk region | 41,347.0 | 43,004.5 | +1,657.5 |
| Chelyabinsk region | 35,511.1 | 36,812.8 | +1,301.7 |
| Total | 99,255.4 | 103,104.6 | +3,849.2 |
Specificities of regional economies determine demand growth. Thus, in the energy system of the Sverdlovsk region large investment projects are mainly in metallurgy (АОJoint-Stock Company KUMZ, АОJoint-Stock Company NLMK-Ural, АОJoint-Stock Company PNTZ, ОАОOpen Joint-Stock Company Svyatogor, PAOPublic Joint-Stock Company Corporation VSMPO-AVISMA), electricity consumption growth is also forecast in the transportation system (ОАОOpen Joint-Stock Company RZhDRussian Railroads – in the Sverdlovsk region). In the energy system of the Chelyabinsk region electricity demand is defined by development of power-intensive metallurgy enterprises (PAOPublic Joint-Stock Company Magnitogorsk Metallurgical Plant, PAOPublic Joint-Stock Company Chelyabinsk Metallurgical Plant, PAOPublic Joint-Stock Company Ashinsky Metzavod, АОJoint-Stock Company KMEZ, АОJoint-Stock Company Tominsky GOK, FGUP PO Mayak, etc.). In the energy system of the Chelyabinsk region electricity demand is driven by production growth of PAOPublic Joint-Stock Company Uralkali, ОООLimited Liability Company Eurochem – Usolye Potash Plant, АОJoint-Stock Company Solikamskbumprom.
Electricity demand outlook in the Company’s areas of service for 2022-2024 (billion kWhkilowatt-hour):
| Energy system | 2022F | 2023F | 2024F |
| Perm region | 23,860 | 24,611 | 25,102 |
| Sverdlovsk region | 43,492 | 44,159 | 44,652 |
| Chelyabinsk region | 36,840 | 37,675 | 38,473 |
| Total | 104,192 | 106,445 | 108,227 |
Mid-term targets and forecasts on macroeconomic and industry fundamentals may be revised in future due to exacerbated geopolitical situation and economic pressures of sanctions on the Russian economy.
Pricing and tariffs in the Energy Sector for 2022-2024
According to the Ministry of Economic Development’s Outlook of the socio-economic development of the Russian Federation till 2024, the national average growth of regulated tariffs for consumers, except for residential consumers, shall total 3.8% in 2022. This decision, on the back of consumption growth, will compensate the gridcos for a significant cost inflation, as a result of upsurge in prices for materials and equipment. In 2023–2024 indexation will correspond with long-term decisions, adopted earlier, that put a system pressure on growing costs of the gridcos. Indexation of tariffs for consumers other that residential consumers will not exceed 3.0% p.a. The above-mentioned indexation does not consider standalone decisions of the Government, made to eliminate local imbalances in standalone regions.
To reduce the scope of cross-subsidy in the sector, indexation of transmission tariffs for residential consumers, on country’s average, shall remain at 5.0% p.a., regulated electricity transmission tariffs for residential consumers growing with the same pace. The dynamics of non-regulated prices for ultimate customers, except for residential consumers, on retail market in 2022 will be at an average of 4.7%. In 2023–2024 it will not exceed the target inflation, stipulated in the scenario conditions, and will be at an average of 2.1%.
Forecasts on changes of electricity tariffs in 2022-2024.
| 2022F | 2023F | 2024F | |
| Indexation of tariffs for all consumer categories, except for residential sector | July | July | July |
| 3.8% | 3.0% | 3.0% | |
| Indexation of tariffs for residential sector | July | July | July |
| 5.0% | 5.0% | 5.0% |
Forecasts on changes of electricity tariffs may be revised in future due to exacerbated geopolitical situation and economic pressures of sanctions on the Russian economy.
Company’s Market Share
OAOOpen Joint-Stock Company IDGCInterregional Distribution Grid Company of Urals renders services to customers across the Perm, Sverdlovsk and Chelyabinsk regions. The Company is a natural monopoly with state-regulated electricity transmission and connection tariffs. The area of service is also abundant in other regional grid operators transmitting electricity mainly through low- and medium-voltage networks. In 2021, the Company’s GRRgross revenue requirement-based share of the electricity transmission market totaled 81%, RGOsregional grid operators’ share being 19%.
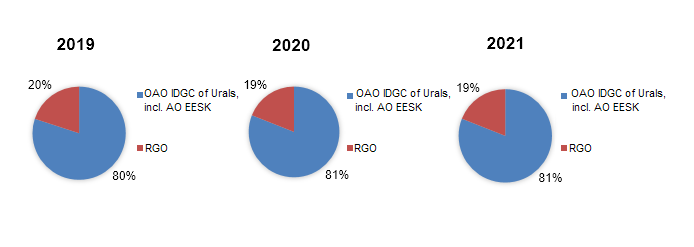
Company’s market share in terms of GRRgross revenue requirement
Peers
There are no public peers in the Company’s area of service. Usually, for evaluation purposes analysts compare Rosseti Ural with other interregional distribution grid companies (PAOPublic Joint-Stock Company Rosseti’s affiliates, rendering services in other regions) that are not Company’s peers.
| Company* | Revenues, RUBruble billion | Net income, RUBruble billion | Revenues, RUBruble billion | Profit for the period, RUBruble billion | Market value, RUBruble billion as of 30.12.2021 | 2021 trading volumes, RUBruble billion |
| RASRussian Accounting Statements | IFRSInternational Financial Reporting Standards | |||||
| 1 | 2 | 3 | 4 | 5 | 6 | 7 |
| Rosseti Moscow Region | 182.0 | 11.6 | 184.7 | 10.5 | 60.3 | 2.1 |
| Rosseti Lenenergo | 93.4 | 19.8 | 93.5 | 15.5 | 87.2 | 12.2 |
| Rosseti Volga | 64.8 | 0.12 | 64.9 | 0.98 | 9.4 | 1.0 |
| Rosseti North West | 45.8 | 1.1 | 50.3 | -0.88 | 4.9 | 0.7 |
| Rosseti North Caucasus | 34.6 | -14.2 | 34.6 | -27.9 | 23.9 | 0.2 |
| Rosseti Siberia | 60.6 | 1.1 | 60.7 | 0.7 | 33.0 | 1.6 |
| Rosseti Ural | 82.7 | 5.2 | 96.5 | 3.8 | 15.4 | 0.6 |
| Rosseti Center | 103.2 | 4.1 | 108.1 | 4.4 | 17.4 | 3.4 |
| Rosseti Center and Volga | 106.4 | 10.6 | 106.7 | 9.95 | 26.0 | 5.9 |
| Rosseti South | 41.5 | 2.1 | 43.4 | -3.7 | 6.9 | 0.5 |
| Rosseti Kuban | 57.7 | 1.7 | 58.0 | 1.9 | 22.3 | 0.06 |
Source: open sources (columns 2-5), Moscow Exchange (columns 6-7).
[1] Source: https://rosstat.gov.ru/storage/mediabank/24_18-02-2022.htm
[2] Source: https://gks.ru/bgd/regl/b21_01/Main.htm
[3] Source: https://economy.gov.ru/material/directions/makroec/ekonomicheskie_obzory/