3.2.1 Network Exploitation and Grid Asset Consolidation
‘
Core production assets in 2019-2021


| MU | 2019 | 2020 | 2021* | |
| Substations | pcs | 33,731 | 34,382 | 39,274 |
| Substation capacity | MVAmega voltampere thousand | 31.4 | 31.6 | 34.4 |
| Power lines (circuits) | kmkilometer | 141,103 | 142,434 | 156,675 |
Increase in core production assets during 2021 was due to leased grid facilities, implementation of investment program, compensation-free transfer of grid facilities and acceptance of no-man’s grid facilities for operation. The Company concluded contracts on the lease of networks of Ozersk Municipal District, AOJoint-Stock Company Svyatogor and AOJoint-Stock Company Uralelektromed.
‘
The Company’s repair and maintenance target for 2021 totaled RUBruble 4,263 million, real expenses in 2021 totaled RUBruble 4,339 million or 102%.
Repair program in 2021 in branches:
| RUBruble million | Target value | Actual value | % of completion |
| Permenergo | 1,536 | 1,570 | 102% |
| Sverdlovenergo | 1,504 | 1,514 | 101% |
| Chelyabenergo | 1,215 | 1,247 | 103% |
| IDGCInterregional Distribution Grid Company of Urals (plus HQheadquarters) | 4,263 | 4,339 | 102% |
The overrun was mainly due to recovery and unscheduled works. Total costs of the branches spent on outsourcing repair works totaled RUBruble 666 million or 15%; with RUBruble 3,673 million or 85% spent on in-house repair works.
Company’s repair program in 2019-2021:
| Works | MU | 2019 real values | 2020 real values | 2021 target values | 2021 real values | % of completion |
| Power line corridor clearing | ha | 8,998 | 9,426 | 9,749 | 10,258 | 105% |
| Groundwire replacement | kmkilometer | 270 | 291 | 199 | 209 | 105% |
| Insulator replacement | pcs | 120,777 | 126,840 | 111,272 | 121,167 | 109% |
| Transformer overhaul | pcs | 48 | 35 | 27 | 28 | 104% |
| Switch overhaul | pcs | 1,848 | 1,726 | 1,643 | 1,712 | 104% |
| Overhaul of isolating switches, short circuitors, disconnecting switches | pcs | 1,524 | 1,394 | 1,643 | 1,660 | 101% |
| Total repair costs | RUBruble mlnmillion | 3,872 | 4,179 | 4,263 | 4,339 | 102% |
Changes in repair volumes are attributable to natural fluctuations coming from repair periodicity. The repair program for 2022 totals RUBruble 4,631 million or +6.7%YoYyear on year, with RUBruble 3,896 million or 84% to be spent on in-house works and RUBruble 735 million or 16% to be spent on outsourcing works.
‘
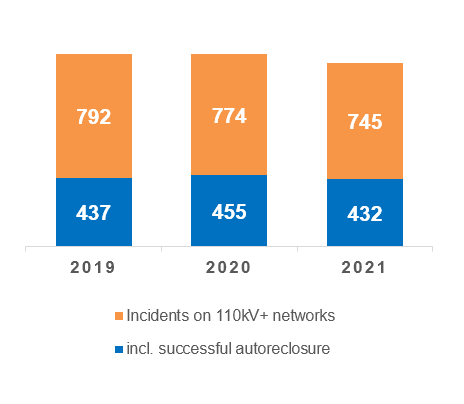
A decline in the number of incidents on 110kV+ networks of the Company’s branches totaled 3.7% on 2020 and 5.9% on 2019.
The diagram shows the amount of incidents and disturbances on 110+ kVkilovolt networks.
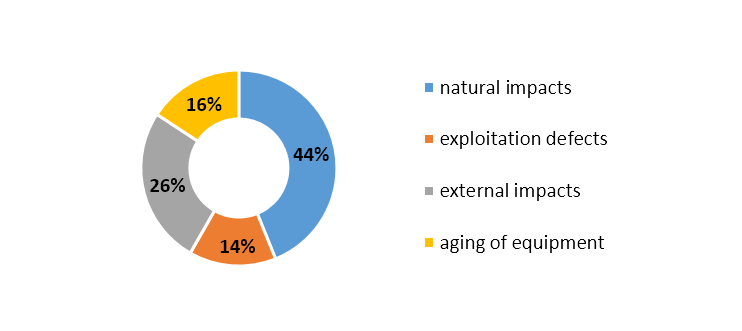
Primary factors of incidents on 110kV+ networks in 2021 are natural impacts, external impacts, aging of equipment, exploitation defects. In 2021, all branches of the Company achieved long-term reliability targets, set by the regional regulators, with significant outperformance.
| Reliability indicators | Isaidi, hour | Isaifi, pcs | ||
| Approved by the REC | 2021 actual value | Approved by the REC | 2021 actual value | |
| Permenergo | 3.0696 | 0.8403 | 1.5123 | 0.8111 |
| Chelyabenergo | 2.9879 | 1.2502 | 1.9023 | 0.9841 |
| Reliability indicators | I adiept, hours | |
| Approved by the REC | 2021 actual value | |
| Sverdlovenergo | 0.0167 | 0.0088 |
In 2021, to enforce reliable grid performance, the Company has approved a set of special-purpose programs on technical development[16]: programs on reduction of incident rate and enhancement of equipment reliability, maintenance and repairs, service checks, upgrade (retrofitting) of grid facilities, reduction of injury risks, enhancement of fire safety, environmental safety, compliance with industrial safety requirements, equipment of high voltage units with arc fault protection, implementation of state-of-the-art security tools and special-purpose vehicles and lifting facilities. The primary expected effect from the special-purpose, repair and investment programs lies in the control of the level of incident rates and creation of conditions for achieving the reliability targets set by the regulators.
‘
OAOOpen Joint-Stock Company IDGCInterregional Distribution Grid Company of Urals (jointly with AOJoint-Stock Company EESKYekaterinburg Electric Grid Company) consolidates grid assets to shape a unified network area on the territory of the Company’s operations helping create a single point of responsibility for reliable and high-quality electricity supply and providing additional possibility to connect new consumers to the consolidated networks.
Primary means of consolidation were:
— Rental. As of 01.01.2022, the volume of rented facilities and facilities with temporary right of ownership and use totaled 71,148 c.u.conventional units;
— Uncompensated retrieval of grid facilities. We created hassle-free conditions for the transfer of grid facilities for any applicant. Applications on the transfer of grid facilities can be submitted through the corporate web site.
Consolidation of grid assets
| Consolidation of grid assets | 2019 | 2020 | 2021 | ||||||
| MVAmega voltampere | kmkilometer | c.u.conventional units | MVAmega voltampere | kmkilometer | c.u.conventional units | MVAmega voltampere | kmkilometer | c.u.conventional units | |
| IDGCInterregional Distribution Grid Company of Urals’ total | 2,992 | 10,839 | 72,589 | 3,267 | 13,003 | 65,856 | 2,621 | 13,639 | 63,567 |
| Acquisition of grid facilities | 102 | 576 | 3,719 | 69 | 228 | 1,058 | 0 | 0 | 0 |
| Rented grid facilities | 2.871 | 10,070 | 68,298 | 3,180 | 12,736 | 64,654 | 2,603 | 13,501 | 63,106 |
| Other (permanent rights of ownership and use) | 19 | 193 | 565 | 17 | 29 | 114 | 11 | 61 | 256 |
| Other (temporary rights of ownership and use) | 0 | 0 | 7 | 1 | 10 | 30 | 7 | 77 | 205 |
| AOJoint-Stock Company EESK’s total | 486 | 1,184 | 7,572 | 550 | 1,300 | 7,913 | 585 | 1,328 | 8,397 |
| Acquisition of grid facilities | 40 | 0 | 336 | 0 | 0 | 0 | 0 | 0 | 0 |
| Rented grid facilities | 434 | 1,184 | 7,150 | 530 | 1,299 | 7,654 | 538 | 1,328 | 7,837 |
| Other (permanent rights of ownership and use) | 12 | 0 | 86 | 20 | 1 | 259 | 47 | 0 | 560 |
| Other (temporary rights of ownership and use) | 0 | 0 | 0 | 0 | 0 | 0 | 0 | 0 | 0 |